
Overview
The Contact Center metrics dashboard provides data on the calls made to the university contact centers. Each contact center is able to see their metrics and filter information by selected call queues.
Training Session recording: available after 11/17/16
First Time Setup
Access to your Dashboard is controlled by membership in an MCommunity group. Contact a group owner for your team to gain access to the Dashboard and your Call Queue(s).
Using the Dashboard
- Log in with your uniqname and UMICH password:
- Ann Arbor and Flint campuses
- Dearborn campus coming soon
- Click a parameter above the ITS wordmark in the top-left corner of the page:
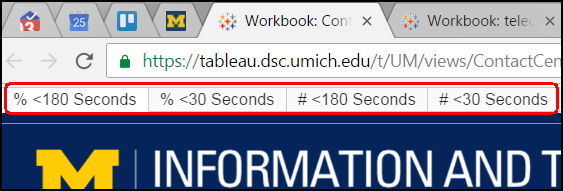
- % <180 Seconds
- Percent of calls answered in less than 180 seconds
- % <30 Seconds
- Percent of calls answered in less than 30 seconds
- # <180 Seconds
- Number of calls answered in less than 180 seconds
- # <30 Seconds
- Number of calls answered in less than 30 seconds
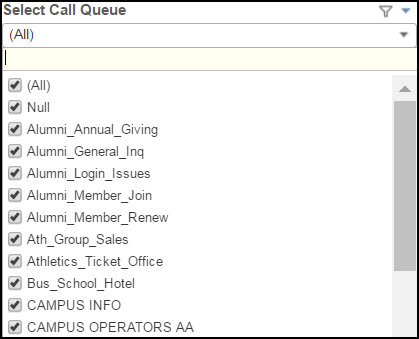
- Select Call Queue(s) from the drop-down list in the top-right corner of the page.
Note: If you don’t see any Call Queue(s), see First-time Setup.
- Available Graphs
- Call Hold Time Less Than 30 Seconds
- 12 Month Handled Call Volume by percent that met or breached hold time SLA of 30 seconds
- 3 Month Handled Call Volume by percent that met or breached hold time SLA of 30 seconds
- Distribution of handled calls by time received and weekday (Last 12 months)
- Distribution of handled calls by time received and weekday that breached hold time SLA of 30 Seconds (Last 12 Months)
- Distribution of handled calls by agent that received call (Last 12 months)
- Use the buttons at the bottom of the page for more actions:

- Subscribe
- Edit
- Share
- Download
Last Updated:
Wednesday, October 26, 2016 - 00:00