Overview
Magic Bus is the application used to view a map of U-M bus routes, search for stops, and find out when the next bus will arrive. There are different ways that you can display the Magic Bus information on digital signs, and this document provides any relevant information for digital sign configuration. For ease of reference, this document is broken in to two specific set of instructions:
- Adding a visual Magic bus map to a digital sign
- Adding estimated wait times for buses via a live data object to a digital sign
Important Resources:
- Google spreadsheet of the Stops and Routes (with links to JSON)
- Magic Bus Logo can be found in the Digital Signage shared content folder, located here: \\dsw-common.m.storage.umich.edu\dsw-common\SharedContent\Resources\magic bus logo.png
Adding the Magic Bus Map
This section is devoted to displaying a visual representation of the Magic Bus map on a digital sign. There are multiple ways to do this, and the URLs for each are described below:
- MBus Web page
- Displays an interactive desktop map, with the MBus routes, buses, announcements, feedback, MBus logo and clickable social media badges. (Note: This URL is not ideal for digital signage, as we do not want to encourage a user to do any web browsing from the digital signs.)
- For interactive kiosks and touchscreen displays
- Functions like a normal desktop map, except with modified timeout behavior so that it can be displayed for an extended amount of time (Note: this setting is overwritten by the designated timing and recurrence of the region that contains this content object)
- For non-interactive screens and web pages
- Displays map without any interactive controls. There is an optional “GET” parameter “stop” that takes a numeric stop ID and centers the map on that stop. List of all Stops and Routes. See anExample
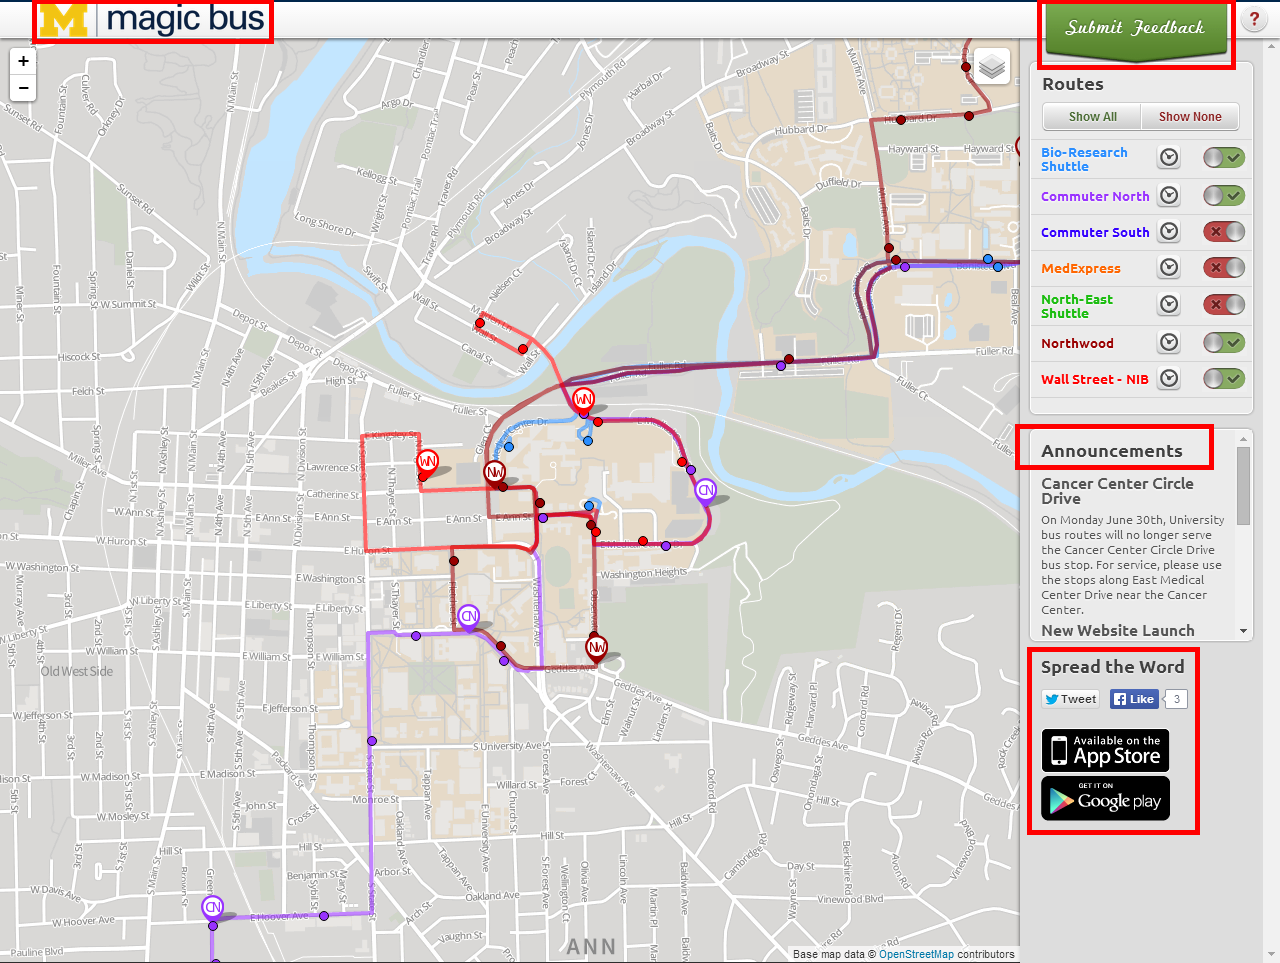
Magic Bus Website
The Magic Bus website looks like this. Of note, the Magic Bus branding, the “Submit Feedback” button, the Announcements (that require scrolling), and the “Spread the Word” section with social media badges. While this can be added to your digital sign, this URL is not ideal for digital signage, as we do not want to encourage a user to do any web browsing from the digital signs. Adding this site to the Digital Sign would be done by adding an “HTML Content Type” where the URL points to http://mbus.doublemap.com/map/
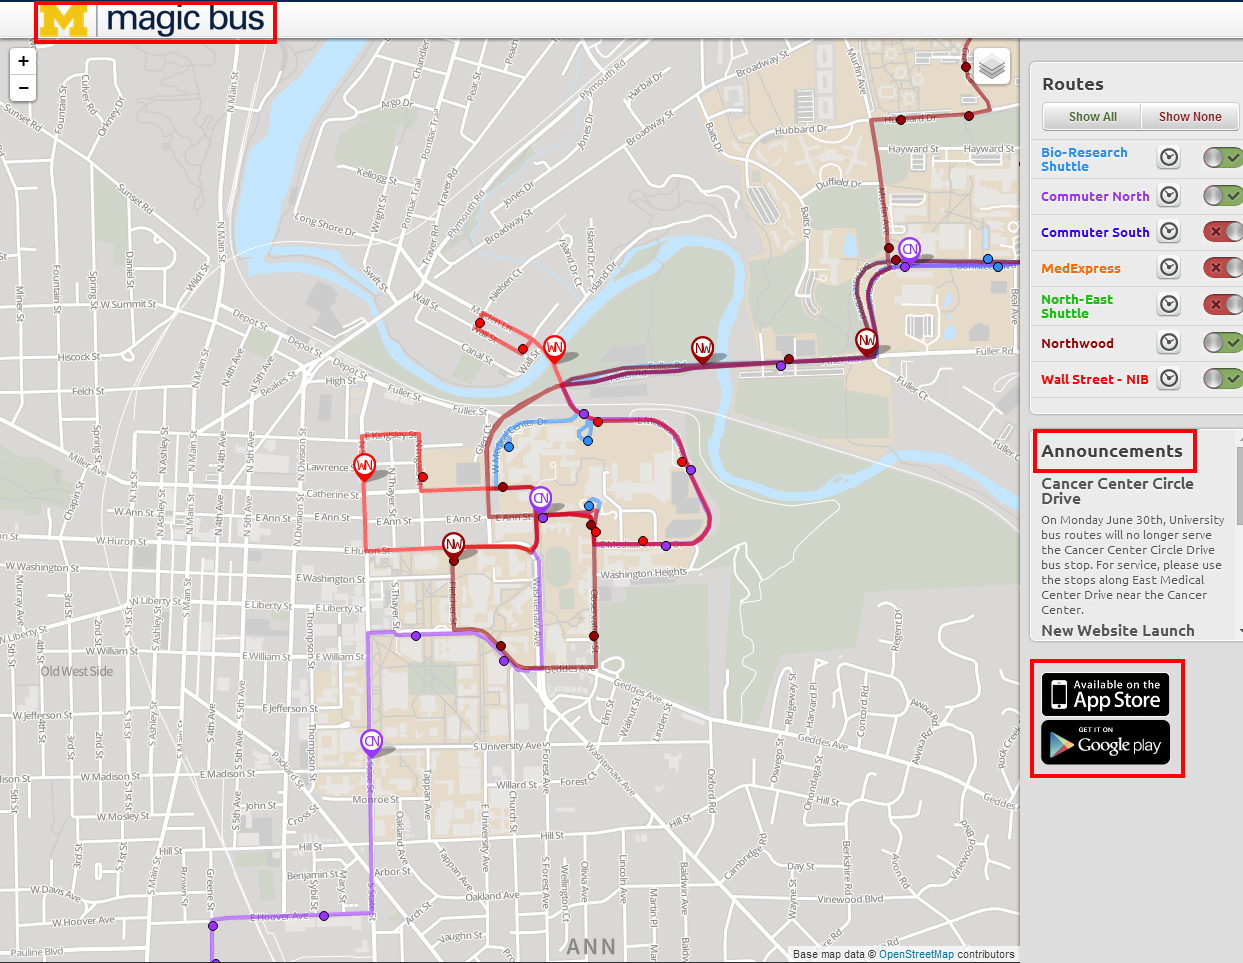
Kiosk Interface
The Magic Bus “Kiosk” interface looks like this. Like the Magic Bus web site, you still see the Magic Bus branding. The “Submit Feedback” button has been removed, and Announcements still requires scrolling. The “Spread the Word” section with social media badges has been modified so that the App Store and Google Play badges are no longer clickable. Facebook and Twitter have been removed. This site has been configured to allow for a longer timeout, although this setting is overwritten by the designated timing and recurrence of the region that contains this content object. Adding this site to the Digital Sign would be done by adding an “HTML Content Type” where the URL points to http://mbus.doublemap.com/map/kiosk
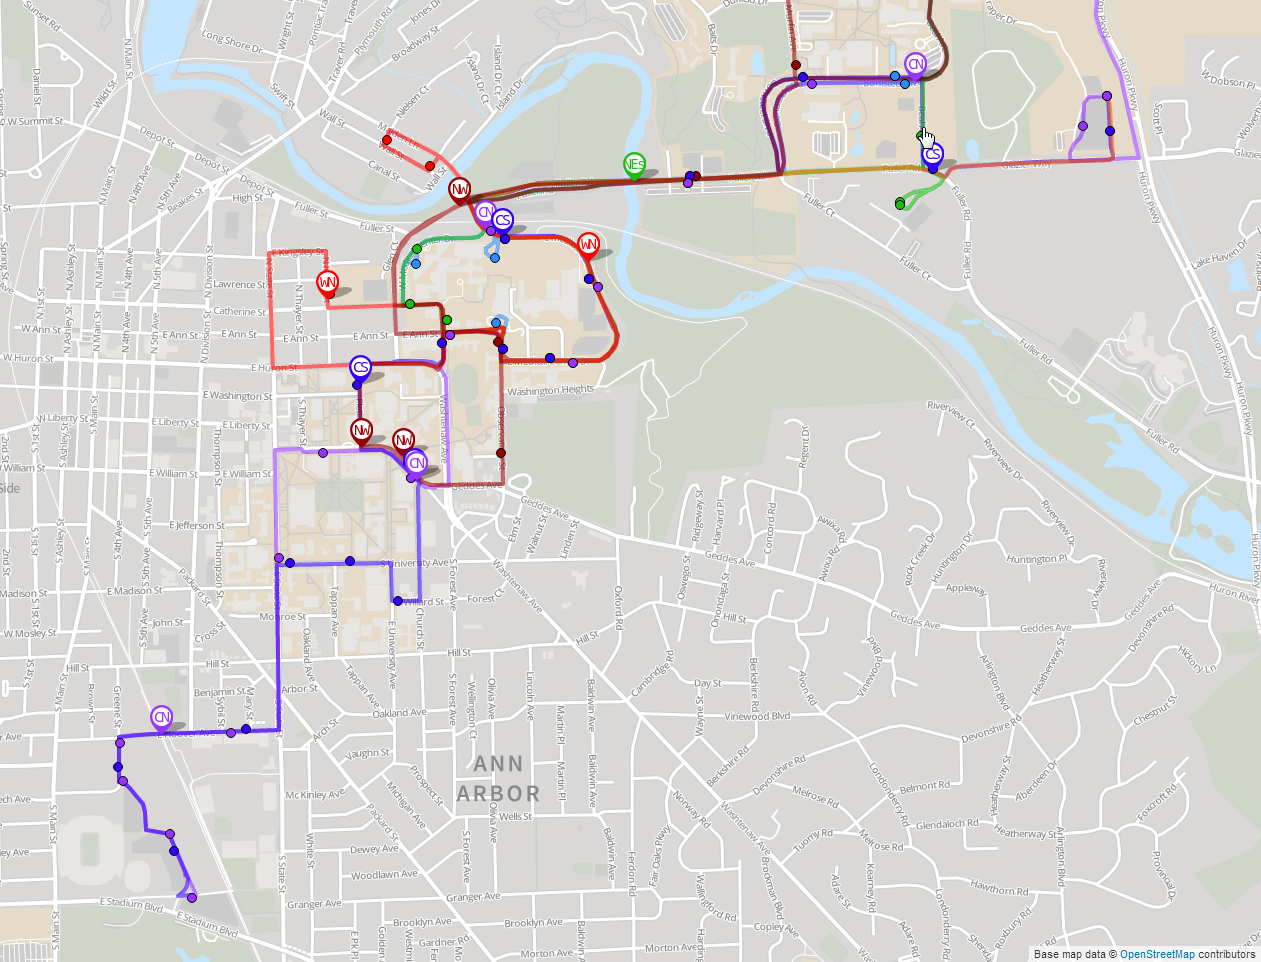
Passive Interface
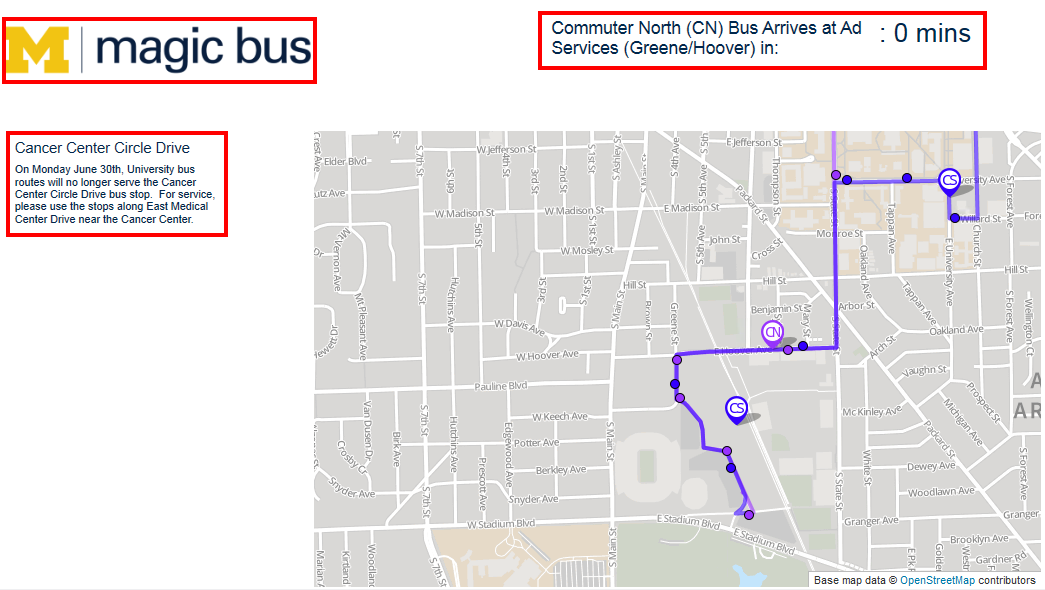
The Magic Bus “Passive” interface looks like this. This interface displays the map without any interactive controls. There is an optional “GET” parameter “stop” that takes a numeric stop ID and centers the map on that stop, so you can zoom in on a particular region of the map.
Passive Interface Options
If you decide to use the “Passive” interface, you can add additional information like the examples provided in the screenshot below. You can add the Magic Bus logo via an “Image” content type (the logo is saved in the Digital Signage Shared Content folder), and you can add Live Data objects to display the Announcements from the MBus site and the ETA data for bus arrival times. The steps for adding the Announcement feed and the ETA data are provided below in this document.
Note: There currently is no “key” or “legend” for the routes if you use this interface on your digital sign. You can create one with another Live Data object, but as of now, there is no pre-defined image that you can use.
Adding Estimated Arrival Times
These instructions will guide you through how to create a textual representation of buses arriving at a specific stop.
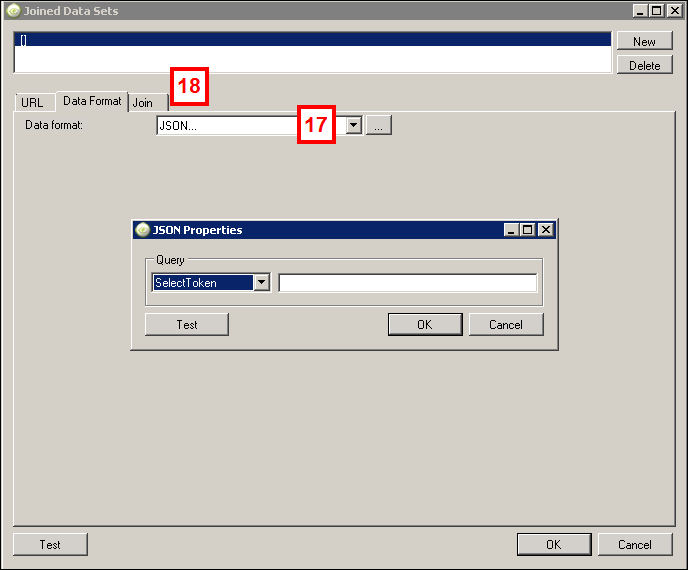
- Select JSON from the Data format drop down list, and then click the ellipsis button
 .
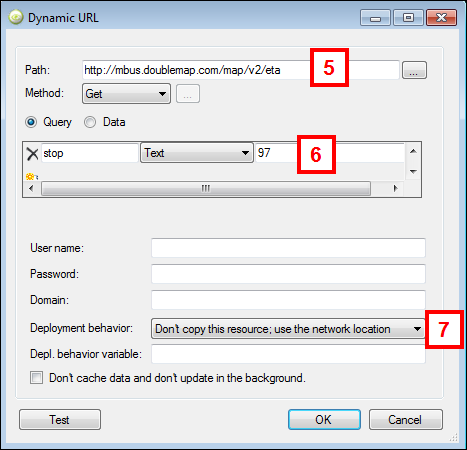
. - In the JSON Properties dialog box, enter etas.97.etas, where 97 is the stop for which you want to display the arrival time of the next bus.
- Click OK to return to the Live Data Properties dialog box.

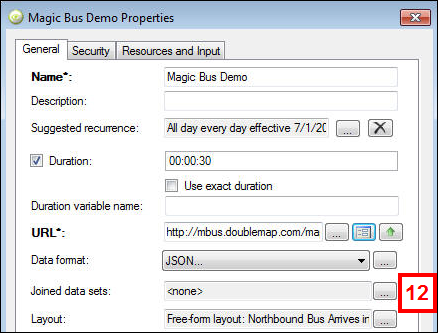
Note: The URL used to pull arrival times of buses for a particular stop returns the ID of the buses arriving; however, bus routes regularly change in the evenings, on weekends, on semester breaks, and during the summer. Due to the changing routes, it is necessary to dynamically pull route names for each stop, rather than using static route IDs. Doing this will correctly identify buses arriving at the stop, even if the routes change. To add this dynamic lookup, use a joined data set to the routes URL.
- Click the ellipsis .
- Click New in the Joined Data Sets window to create a new joined data set.
- Enter the route's URL: http://mbus.doublemap.com/map/v2/routes/ in the path.
- Change the deployment behavior to Don’t copy the resource; use the network location.
- Click the Data Format tab.
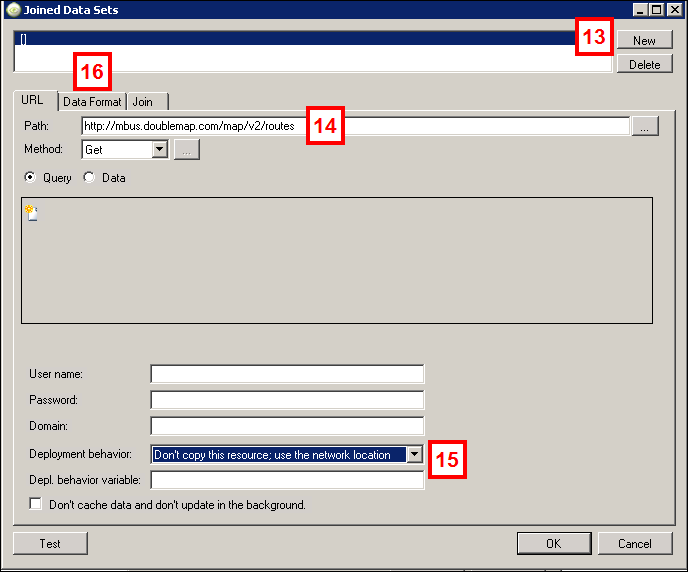
- Select JSON from the Data format drop-down list and click OK on the JSON Properties window.
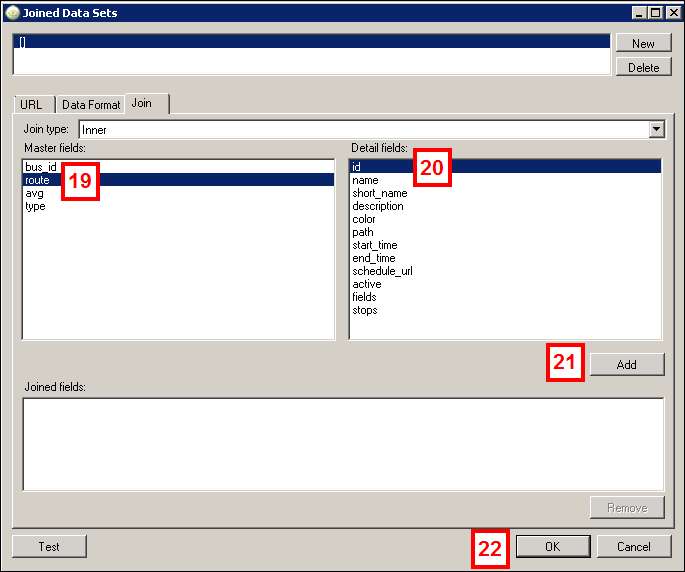
- Click the Join tab.
Note: In this section, we connect the id of the bus arriving at the stop to the name of the route in the routes data.
- Click route in the Master fields.
- Click id in the Detail fields.
- Click Add to create a join between these two fields. The join should appear in the joined fields at the bottom.
- Click OK to return to the live data properties window.
- Click the ellipsis next to the Layout field.
Note: The live data layout should contain all the fields from both the eta URL and the routes URL. Because of this, we can combine the route name with the ETA to provide a textual, easy-to-read representation of incoming buses. The layout design is entirely up to the user. For more information, please review Configure the Layout of Live Data Content. The layout details below are helpful hints to making the live data easier to read.
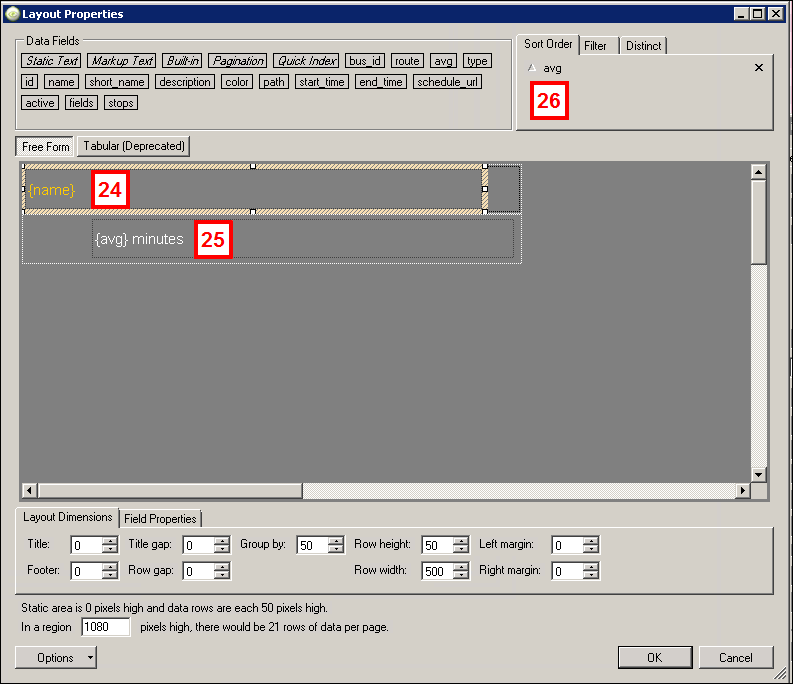
- After adjusting row height and width, drag down name from the Data fields to the layout. This contains the name of the route which will be stopping at your identified stop. If there are multiple buses stopping at the stop, you may consider using a group-by field. This will collect arrival times for each route in to labelled sections. To do this, choose add group by band from the Options drop-down list near the bottom-left of the window. This will provide another section to the layout (the height can then be adjusted using click and drag or the Group by adjuster below). Drag name to this section (instead of the row). This appears in yellow.
- For the ETA of the bus for that route, pull down the avg field. If you want to make it easier to read, drag down a markup text field and type: {avg} minutes
- Drag the avg field to the Sort Order tab at the top. This will sort the arriving buses beneath each header by how much time there is until the bus arrives at the stop.
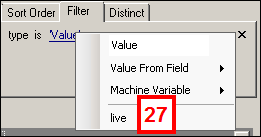
- Drag type to the Filter tab. In the filter, click Value. Select live from the drop-down list that appears. This will ensure only active buses appear on the screen.
- Click OK to return to the Live Data Properties dialog box.
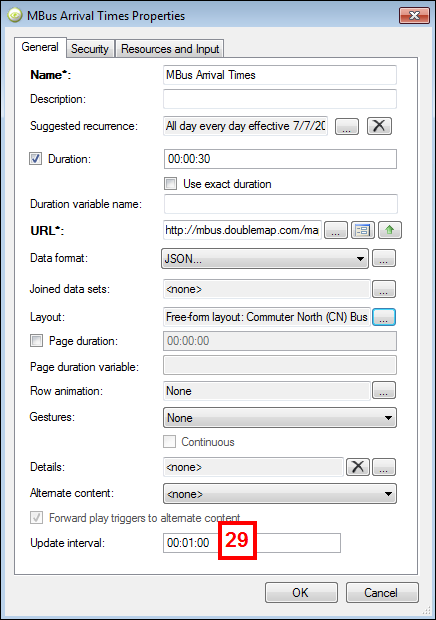
- Enter one minute 00:01:00 in the Update Interval field.
- Click OK to close out of the Live Data Properties.
- The final step is to drag the new Live Data content object from the Content area of Content Manager into the Network Overview, specifically, in the region you’ve designated in the template for this content object.